Vim 8.1 was released in May 2018. The “main new feature” was official support for running a terminal within vim. Along with this came a built-in debugger plugin, termdebug, which provides a visual interface for interacting with gdb. This post walks through an example session using termdebug.
Let’s use termdebug to step through and inspect the following C program that calculates the factorial of a number. I’ll be using Ubuntu 18.04, along with a version of vim installed from the Ubuntu repo—8.0.1453—that includes the relevant feature that was officially released as part of vim 8.1.
| #include <assert.h> | |
| #include <stdio.h> | |
| #include <stdlib.h> | |
| /* | |
| * Calculates factorial. | |
| * Overflow is not checked/handled. | |
| */ | |
| int factorial(int x) { | |
| assert(x >= 0); | |
| int result = 1; | |
| for (int i = 1; i <= x; ++i) { | |
| result *= i; | |
| } | |
| return result; | |
| } | |
| int main(int argc, char* argv[]) { | |
| assert(argc == 2); | |
| int x = atoi(argv[1]); | |
| int result = factorial(x); | |
| printf("%d\n", result); | |
| return EXIT_SUCCESS; | |
| } |
In addition to vim, a working version of gdb is required for debugging. For Ubuntu, this can be installed from the Ubuntu repo. For macOS, gdb will have to be code signed, and I’ve found that gdb versions earlier than 8.3 are problematic (tested on macOS Mojave). I haven’t tested debugging on Windows. Before trying to debug with vim, I suggest verifying that gdb works as expected on your system.
The path and/or name of gdb can be modified by setting the termdebugger variable before invoking the termdebug plugin.
Loading the termdebug Plugin
After loading the factorial.c source code, let’s load the plugin.
:packadd termdebug
:Termdebug
The tab will split into three windows, which I’ve rearranged so that the editor window is on the right, as shown below.
The top-left window is for interacting with gdb. The bottom-left window is for interacting with the program loaded by gdb. The editor window on the right—with the corresponding source code—will show breakpoints and highlight lines when stepping through a program. This window also has clickable buttons at the top for interacting with gdb.
Loading a Program
We’ll have to compile the code using the -g flag, which will include debugger information in the compiled program.
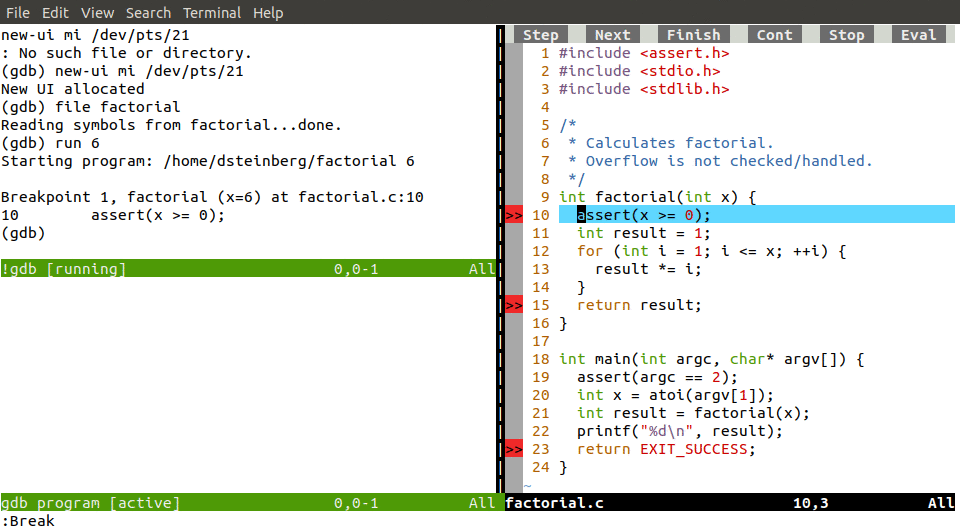
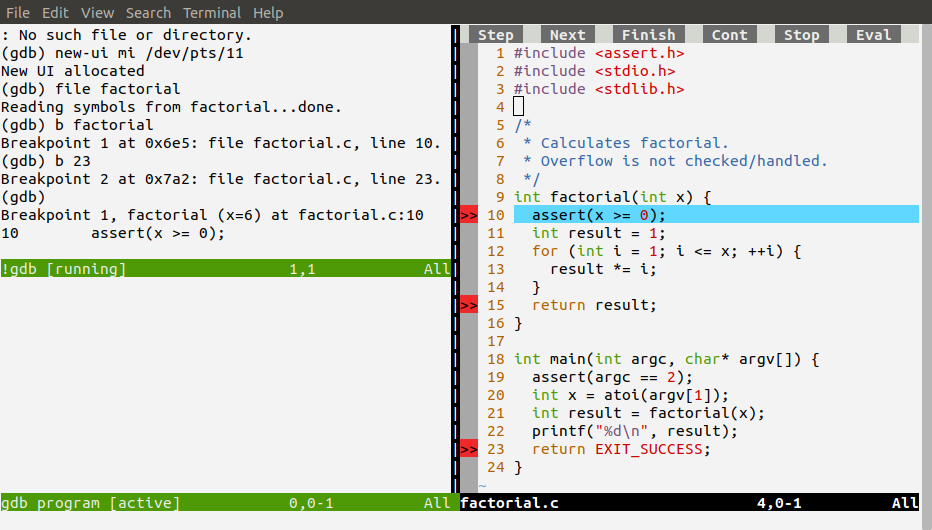
:!gcc -g factorial.c -o factorialWe can use the gdb window to load the program. In addition to <c-w> commands and/or mouse clicks, we can use the :Gdb command to jump to the gdb window. The following gdb command will load the program (highlighted in the image that follows).
(gdb) file factorial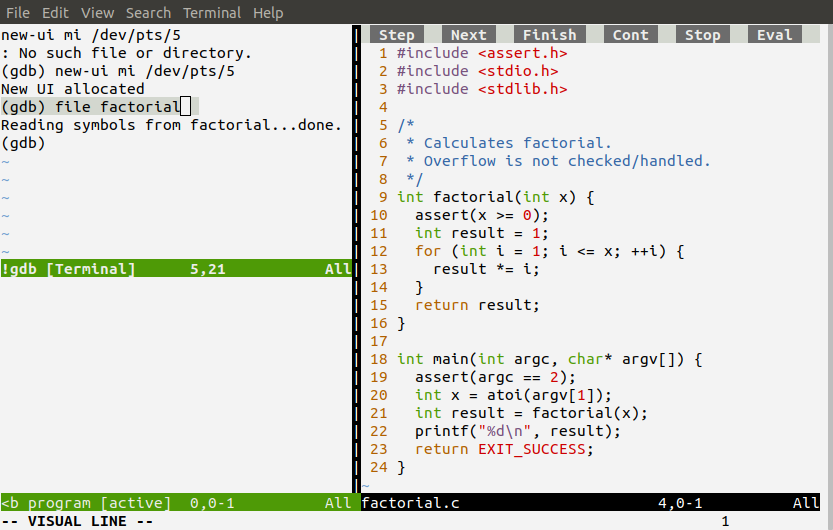
Alternatively, we could have passed factorial as an argument when calling :Termdebug earlier.
Setting Breakpoints
Breakpoints can be set in the gdb window using ordinary gdb commands.
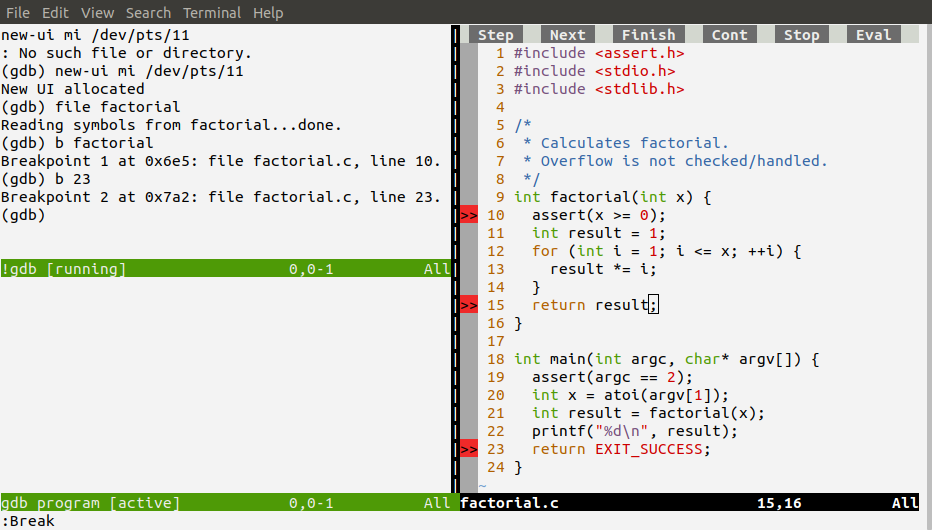
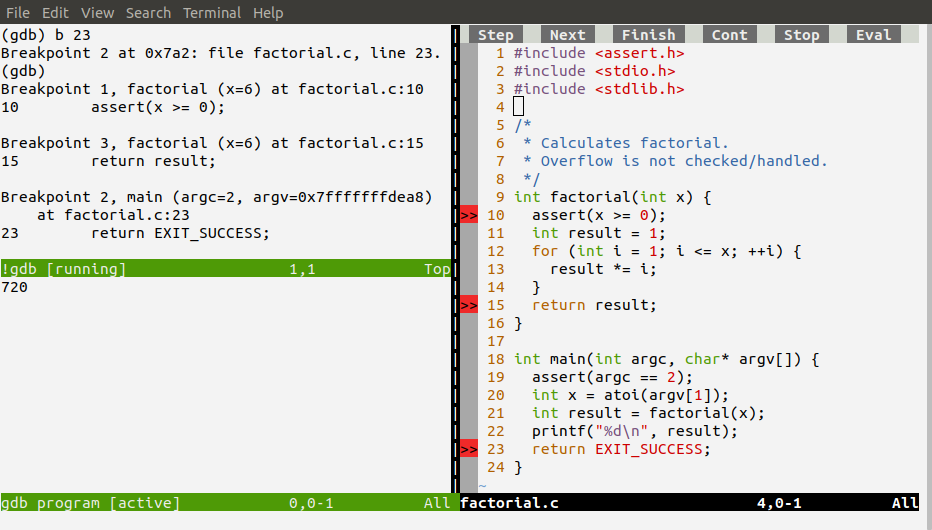
(gdb) b factorial
(gdb) b 23
Alternatively, breakpoints can be set by navigating to a line of code in the editor window and entering :Break.
Lines with breakpoints are indicated by >> in the editor window.
Breakpoints can be removed with gdb commands or by navigating to the relevant lines and entering :Deletevim, :Delete is used to remove breakpoints, but this was changed to :Clear in a commit on March 3, 2018.
Program Execution
The :Run command starts the program.
:Run [args]Or alternatively, a program can be launched by entering the run command directly in the gdb window.
(gdb) run [args]In either case, [args] should be replaced by the program’s arguments. Let’s use the value 6 to run the factorial program.
Both :Run and (gdb) run will pause execution at the first breakpoint. An alternative way to launch a program is to use gdb’s start command, which will pause execution at the beginning of the program.
I’ve launched the program using the vim command :Run 6. Execution is paused at the first breakpoint, with the corresponding line highlighted.
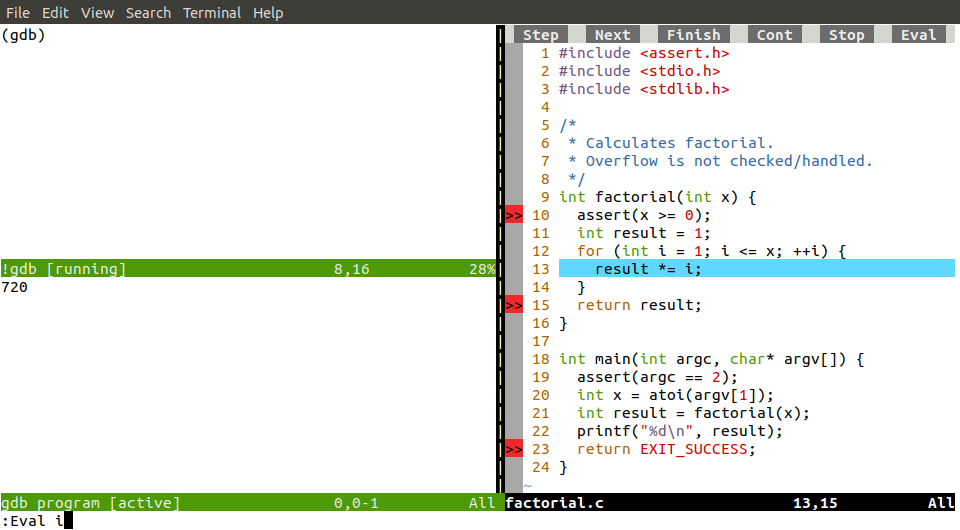
Stepping through Code
There are various ways to step through a program.
- Invoking
gdbstepping commands directly in thegdbwindow - Clicking Step, Next, Finish, Cont, Stop, Eval in the editor window
- Issuing
vimcommands:Step,:Over,:Finish,:Continue,:Stop
Program Inspection
The values of variables can be inspected in various ways.
- Invoking
gdbinspection commands directly in thegdbwindow - Hovering your mouse over variables in the editor window
- This requires the
+balloon_evalcompile-time feature - This worked for me in
gvim, but didn’t work reliably when runningvimin a terminal
- This requires the
- Issuing
vimcommand:Evaluate {expr}
Omitting{expr}will evaluate the expression under the cursor, which can also be performed by pressingK
Conclusion
After passing all breakpoints and running the program until termination, we can see 720 in the program window, which is the expected output for the calculation of 6!.
The built-in help page includes thorough documentation.
:help terminal-debug
62 replies on “Debugging in Vim”
Awesome! What else can be done with this terminal-in-Vim functionality?
Hi Michael, I think the following blog post may address your question.
https://medium.com/usevim/what-is-modern-vim-2591f6b1ec04
how can this be used with libtool-enabled programs?
Hi adynatos, the following libtool documentation suggests that disabling shared libraries during development can facilitate debugging.
https://www.gnu.org/software/libtool/manual/html_node/Static_002donly-libraries.html
Hi, how did you rearranged the layout?
Hi Beamer, I’ve rearranged the windows so that the editor window is on the right. To do this, I moved the cursor to the editor window and entered
ctrl-w L.Documentation for moving windows is at
:help window-moving.Thank you for the great article! Is there a way to have your layout as a default?
Hi lbom, this layout can be set by configuring
g:termdebug_widein your.vimrc.See
:help termdebug_widefor details.Hi Daniel. Are you aware of any plugin/.vimrc which builds on
termdebugAND Vim 8.1’s terminal windows to provide an easier workflow?I’m referring to keys being mapped to :Step, :Next, and the likes, for instance, as 6 or more keystrokes everytime I simply want to move to the next line are a bit too much.
Furthermore, I see that commands like
:packadd termdebugand:Termdebug vimhave to be run everytime I start a new Vim session.I wonder if such a thing exists. There are some results on GitHub, but having your thoughts on this topic would be useful!
Hi Enrico,
I’m not aware of any plugins that build upon
termdebug.:packadd termdebugcan be added in your.vimrcso that you don’t have to enter that command for each Vim session.With that added,
termdebugcan be launched with:Termdebugor with a custom mapping in your.vimrc, like the example below that loadstermdebugwith<leader>td(where<leader>would be a backslash, unless modified from its default).There are various ways to speed up the entry of
:Step,:Over, and the others. The following approaches are mentioned in the blog post:gdbstepping commands directly in thegdbwindowStep,Next,Finish,Cont,Stop,Evalin the editor windowIn case you’re looking for an alternative approach, the following custom mappings—or some variation—for your
.vimrcmay be helpful. These map the stepping commands to<leader>sand<leader>o(where<leader>would be a backslash, unless modified from its default).The >> symbols doesn’t appear neither the top bar, even If I use :Winbar.
Anyone know what it could be? I have terminal activated
Hi GGCristo, does the breakpoint symbol appear after you enter
CTRL-Lor:redraw!to redraw the screen? If so, there is seemingly a problem preventing the screen from being updated when it should be.Thanks for answer, I have never seen << neither lines highlight, neither the clickable bar.
At first I tought that that windows it was a regular code source, but I can press K above a variable and it tells me it value, so it doesn't seem to be the problem here.
Does the breakpoint functionality work for you in
GVim?Which version of
gdbare you using? Thevimsource code suggests thatgdbversions lower than 7.12 are not supported.Hi Daniel.
how to switch to the source code window from the gdb window after i enter some commonds in the gdb windows? I tried , but that didn’t work.
Hi wckang, there are various ways to switch to the source window.
ctrl-wcommands to navigate away from thegdbwindow.ctrl-w hctrl-w jctrl-w kctrl-w lgdbwindow, switch to Terminal-Normal mode withctrl-w Norctrl-\ ctrl-n, followed by:Source. Terminal-Job mode can be entered withiin thegdbwindow for entering additionalgdbcommands there.I forget to add: I use neovim
Hi wckang, the first and third methods in my comment above worked for me in
neovim.Thanks a lot! ctrl-\ ctrl-n works!
Hi Daniel.
I have another question:how to remap the shortcuts in termdebug? In my neovim configure, the K has been mapped, so that will conflict the K in termdebug.
The
Kkey intermdebugis equivalent to:Evaluate. The following example maps this to<leader>K(where<leader>would be a backslash, unless modified from its default).Awesome, great post! Bonus info: What colorscheme are you using? 🙂
Thanks! The colorscheme is default, on an Ubuntu terminal with the following color settings:
What is the use of !gdb pane? If it is not that important do you know any way to get rid of that?
Hi Makmek. The
gdbwindow is for interacting withgdbby entering debugging commands directly. For example, breakpoints can be entered here withb, and stepping commands can be entered here too (e.g.,stepandnext). The program window is for I/O from the running program.I do not know how to remove these windows. I haven’t tested, but an alternative could be to change window sizes (e.g.,
ctrl-w _andctrl-w |) and/or move windows to separate tabs (e.g.,ctrl-w T).Thanks for the response.
I was not referring to the gdb pane. I was referring to the one below the gdb pane in your picture (Sorry I got the status bars confused in the previous post). That pane is an extra annoyance when switching panes (between vim and gdb).
I am currently using ctrl-w _ and it is a good workaround to get more space for the gdb pane.
I found a way to do this. You have to ‘set hidden’ first. Then you can use C-w c to close the pane while keeping the buffer in the background. When that pane is closed you can do C-w w to switch back and forth between gdb and vim easily.
I’m glad to hear it’s solved. I posted a similar idea 12 minutes after your comment, having missed your comment while writing mine.
The program window is for I/O from the running program, for displaying the
stdoutandstderrstreams, and taking input through thestdinstream.I guess this window is not useful if e.g., your program takes input from command line arguments and/or files, and writes output to files without using
stdoutnorstderr.Another option, as an alternative to resizing the program window with
ctrl-w _, is to navigate to the program window and close it withctrl-w c. The following custom mapping—or some variation—for your.vimrcmay be helpful. This mapsctrl-\ cto a key sequence that closes the program window. The mapping assumes it’s run from thegdbwindow in terminal-job mode.Hi Daniel,
I case you (or someone else reading this post) like to use
:set nuand:set rnuin Vim but you would like to:set nornuwhen you’re in the!gdbterminal window, so that it’s easier to use thebreakcommand, for instance, please check out the autocommand I’ve defined here.Cheers,
Enrico Maria
What the heck! How do I format code and URLs in this blog??
Hi Enrico, I had been formatting comments using HTML tags. I see that you’ve used markdown, so I’ve turned on the markdown in comments functionality, and your comment now appears properly formatted.
I’ve found this place to be the best summary (still
:help terminal-debugis a quite good read and not too long).There is one thing that puzzle me:
How can I pass arguments to GDB upon start? Previously I had written every necessary GDB commands into a .gdb file and then start gdb as
gdb -q -x my.cmds.gdb myexecutableand I have not yet found a way to pass those gdb commands into the GDB session under VIm’s control. Starting a vim’d gdb similar to above can be done via/opt/vim/bin/vim -c "packadd termdebug" -c "let g:termdebug_wide=1" -c "Termdebug myexecutable" -c "resize +10"so the only missing part is to send gdb thesource my.cmds.gdb. Any idea how to do this?Hi Simon,
I don’t know if there is a built-in way to do that.
As an alternative approach, you can create a wrapper around
gdb, which uses your custom arguments, and then setg:termdebuggerto use that wrapper.For example, a
gdb.shwrapper could be the following.After 1) setting that script’s executable bit (e.g.,
chmod u+x gdb.sh), 2) adding it to some directory on thePATH, and 3) runninglet g:termdebugger='gdb.sh'in Vim, then:Termdebugwould utilize your custom arguments.Alternatively, if you don’t add
gdb.shto a directory on yourPATH(or updatePATHto includeghd.sh’s directory), theng:termdebuggercan be set using the full path to the wrapper (e.g.,let g:termdebugger='/some/path/to/gdb.sh').After the wrapper script is created, setting
g:termdebuggeraccordingly could be incorporated into the call to Vim that you posted above.Thank you for the tip. I’ve later read about the variable in the help and for a short moment thought this may be a possible hack but then thought there should be a way to put anything from vi into gdb.
Maybe switch to its window/buffer and place the command + CR into it (I have no idea if something like this works with vim)?
After the post I’ve also checked the termdebug source a bit and the MI protocol an it looks like it may be able to Send gdb the original command via VIM->MI or write to the hidden buffer “gdb communication”. But also in these two cases I have no clue how to do that :-/
There’s a
TermDebugSendCommandfunction for sending commands togdb.That could be called from your launcher command, combined with your
my.cmds.gdbcommands file, hopefully achieving the desired outcome.That looks cool. I wasn’t aware of the
:calloption, works fine in general and is also quite handy for additional key mappings as mentioned in https://vimhelp.org/terminal.txt.html.Only things to take care: all of those additional commands need to be placed after the initial
-c TermDebugand the command file should not include anattach(as that would not use the stdin/out buffer of vim), possibly also not afile(haven’t checked that).Starting a new VIM-gdb’d debug with manual commands work perfectly now and I guess I’ll also find out how to attach that way…
:Termdebug myexecutable 1234leads to a strange screen state where I need to [ctrl]+[c], then answer gdb to “continue” an “no”, don’t kill the process, even when called from within VIm, the behavior with-c 'Termdebug'is identical. But altogether I’ve learned a good amount of VIm and Termdebug stuff today – thanks!If
1234is intended as an argument formyexecutable, the:Termdebugcommand won’t work as shown in your example, as it doesn’t permit arguments to be passed for the program being debugged. The second argument toTermdebugis interpreted as a process ID (for attaching to an already running executable) or a core file.To pass arguments to the program, there is
:TermdebugCommand.As my post was about attach 1234 was intended to be a PID. The attach actual “works somehow”:
Termdebug is started
gdb is started with the correct file myexecutable and seems to attach to 1234
But: then I need to [CTRL]+[C] first, then gdb-“c”ontinue the pagination, then tell gdb to “n”ot start a new process and to not kill the process and then get out of the debugging.
GDB and Vim are both on latest release. A plain attach with plain GDB works, running a new program in Termdebug also works fine, but the combination does not.
A possible workaround could be to attach using a
gdbcommand directly (through the plugin), instead of using an argument toTermdebug.One approach to do that could be to run
:Termdebug myexecutableand then attach to a process by enteringattach 1234in thegdbwindow.Or alternatively, the same idea could be incorporated into your launcher.
In the first screenshot of this tutorial, the vim source code (right-hand side) has some buttons on the top (Step, Next, Continue, Stop etc.).
What are the vim settings to get these buttons?
Hi vijaychsk,
If Vim was compiled with menu support (
:echo has('menu')would show1) and'mouse'is set (:set mouse?would show e.g.,mouse=a), thetermdebugplugin adds the toolbar. The functionality is not supported in Neovim.In addition to the toolbar, the plugin also configures a popup menu that can be used for setting breakpoints, clearing breakpoints, and evaluation (see
:help termdebug_popup). The popup menu can be opened by right-clicking with the mouse. Like the toolbar, popup functionality requires+menuand'mouse'support.Hi,
Thank you for the great tool! Now I can map all F? keys and debug my codes almost like I did in good old turbo-pascal (in the previous millenium in a country that ceased to exist:) .
There is, however, an annoying difference. If I put a breakpoint on some line with “:Break”, and add few lines above it the marker of the breakpoint moves down together with the text, but gdb still thinks of a breakpoint at the old line number, which is currently another line of code. Is it a bug or a feature, or just something wrong with my setup? It would be great to keep breakpoints in sync between gdb and vim, and let them move together with the text.
Hi Rostislav. I observe the same behavior that you’ve described.
It appears that the breakpoints can be synchronized after editing by 1) re-compiling, 2) reloading the file in
gdb, 3) removing existing signs, then 4) re-editing the file to triggerBufReadand the subsequent breakpoint sign placement. This can be handled by a function with a corresponding:Compilecommand, as shown below (the example code is not general, as it makes multiple references that are specific to the blog post).However, this won’t move breakpoints to account for new lines of source code. For that, I guess a more substantial solution would be necessary. I’m unaware of any built-in functionality for handling that.
Gratitude for
termdebugshould be directed towards Bram Moolenaar, the creator of Vim, as he implemented the plugin.The
locationattribute of a breakpoint is not writable, so the only way to handle this would be:use mi-protocol to create a new breakpoint at the new place
use mi-protocol and the python api to copy the commands and conditions from the old breakpoint
use mi-protocol to delete the old breakpoint
To limit this would only to be done on the saving of the file and still would have the culprits:
* the breakpoint may be referenced, for example in python code elsewhere – and that would not have the new reference
* the breakpoint has “magically” a new number
… therefore I’d say this would be a mis-feature (actually more a bug than a feature).
What I do consider a bug is that the Breakpoint does not stay at the same line, maybe you want to create an issue at https://github.com/vim/vim/ about that (if it isn’t there already)? Note: “keeping it” may also be hard because if that breakpoint is not using a line but either an address or something like “break on the label xyz” then this is not unlikely to also be broken…
Hi, do you know why it isnt showing the buttons(like step, over…) in my gdb gui? I am using Ubuntu 20.04 and vim 8.2? These operations can be performed with “:Operation” in vim too, right?
Hi ctrebo, the code for loading the toolbar checks for
has('menu')and checks that themouseoption is set. Do both of these conditions apply in your case? For the former,:echo has('menu')should return1. If not, the+menufeature was not enabled when compiling your version of Vim, and should be enabled at compile-time to permit the toolbar to load. For the latter condition,:set mouse?should show a non-empty value for that option. If it’s empty,:set mouse=awould enable the mouse across a range of Vim modes and permit thetermdebugplugin to load the toolbar.Hi,thank yoz very much. The :set mouse=a solved it for me!
The toolbar items correspond to the following Vim commands:
:Step:Over:Finish:Continue:Stop:EvaluateThanks for the concise introduction to termdebug Daniel, just what I was looking for!
I think at the present day you can mention Vimspector (https://github.com/puremourning/vimspector).
I’ve tried out recently, and I can’t tell you how much that plugin is great.
Graphical debuggin in Vim. (Clearly “graphical” doesn’t mean “mouse”, as you can do everything without touching the mouse.)
Do you know if it is possible to clear the Output window? It makes searching easier when there’s less information in the window.
I tried searching for solution, but couldn’t find anything useful. For now I just restart debugger :/
That’s normally not what GDB does, but actually some thing that works with Vim: – you can resize the interactive window to 1 line
:resize 1(as long as the window is interactive use [CTRL+W] to be able to send commands), then make it bigger again – and voila – the window has only the last entry visible.I’m not sure how all contents, including the scrollback contents, can be cleared.
For just clearing the visible portion of the screen (but the contents are pushed into scrollback), it’s sufficient on my system to send the
\033\0143sequence.For example, here’s a corresponding
ClearProgramcommand.Here’s a
ClearProgramcommand based on Simon’s suggestion.Thank you guys for trying to help. I’d rather have a way of clearing scroll back, as I regularly restart the debugging application, which produces lots of log entries. After a while it is hard to navigate through all of the logs. For example if i want to search for a given log entry, and I don’t want to search in the logs from previous runs of the debugged application.
So i found that gdb window can be cleared, while execution is paused with CTR+L, but unfortunately this doesn’t work for the program output.
Thank you for this good introduction !
Unfortunately, the arrow up key (repeat last command) does not seem to work in the gdb window which acts just like a normal vim edit window and not like a command shell window (arrow up = last command etc.) Am I missing something ?
Hi Mick, the arrow key cycles through the command history for me. It sounds like you might be in
Terminal-Normalmode instead ofTerminal-Jobmode. If so,Terminal-Jobmode can be entered by pressingiin thegdbwindow.ctrl-w Norctrl-\ ctrl-ncan be used to switch back toTerminal-Normalmode.Thanks for the quick reply.
I can switch between modes but Unfortunately, the arrow key still does not work for me.
I am using vim for windows btw. Also there seems to be no tab completion and other essential readline features in the :Termdebug gdb window
Possibly
:versionshows-jobinstead of+job?The vim build may did not have any readline available during built time so that was disabled explicit. I’m just guessing here but that would be a valid reason to default to terminal-normal instead of terminal-job, too.
Did you built Vim on Windows for yourself? If not where is it from?
I guess this might be related to
Termdebugrunning inPrompt modeon Windows (see:help termdebug-prompt), since the same issue occurs on Linux when settingg:termdebug_use_prompt = 1, to run in that mode.I don’t know if the behavior is an expected limitation of running in
Prompt mode.Using
ctrl-nandctrl-pfor completions might be a partial workaround (not as good as built-in completion and history support, but presumably better than nothing).Thanks again for your answers & suggestions.
After looking at the source code of termdebug and consulting other forums it seems that Windows does indeed only support the “prompt” buffer mode. This is really a pity because a graphical debugger ist about the only thing I’m really missing in my vim-instead-of-an-IDE workflow (using gnu-tools on mingw). I tried haf a dozen other gdb-frontends for vim, but none of them worked satisfactory on windows. So now I’m considering setting up VScode as a debugging-only-tool.